
Data-Driven Power Moves: A Step-by-Step Framework for Turning Insights into Impact
- Michael Lee, MBA
- Oct 2, 2024
- 5 min read

In a world overflowing with data, how do successful organizations consistently turn that information into meaningful actions? It’s not enough to simply collect data. Without a structured approach, you risk misinterpreting the data or, worse, making decisions based on flawed insights.
This is where a well-defined data analytics framework comes in. Think of it as a roadmap that guides you from identifying a problem to generating insights that can transform your business. Let’s walk through this framework step by step before diving into real-world examples of how it can be applied for maximum impact.
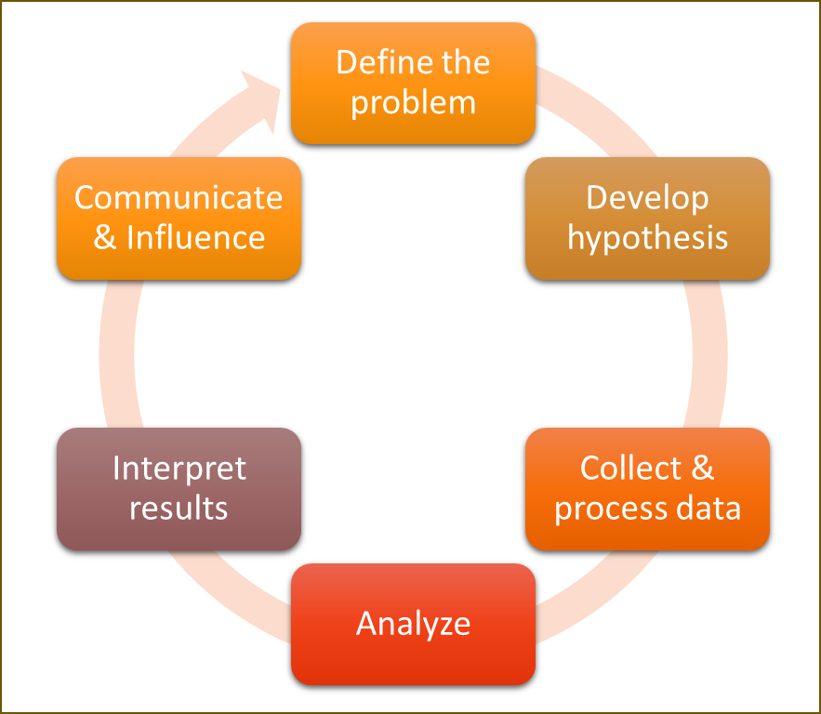
The Framework Explained
Define the Problem: The first and arguably most critical step is clearly defining the problem you’re trying to solve. Without a well-defined problem, even the best data can lead you in the wrong direction. You need to ask: What is the specific issue or opportunity that data can help us address?
Develop Hypothesis: Once the problem is clear, form a hypothesis that predicts what you expect to find. This gives your data analysis a focus, helping you identify the relationships and patterns you’re interested in exploring.
Collect & Process Data: After you have a hypothesis, it's time to gather relevant data. Data collection is only half the battle—you must clean and process the data to eliminate errors, inconsistencies, or missing entries. This ensures that your analysis is based on accurate and reliable data.
Analyze: This is where the magic happens. Once your data is ready, use analytical methods to test your hypothesis. Whether you're running statistical models, creating visualizations, or using machine learning, this step turns raw data into insights.
Interpret Results: Data doesn’t speak for itself—you have to interpret what the results mean in the context of the problem you're trying to solve. This is where you connect the dots and determine whether your hypothesis was correct or if new insights have emerged.
Communicate & Influence: Finally, the most important part of any data analytics project is communicating the results to stakeholders in a clear, actionable way. Data on its own doesn't drive change—people do. Whether through reports, presentations, or dashboards, your ability to influence decisions depends on how well you present your findings.
Now, let’s see how this framework comes to life with real examples.
Example 1: Retail Sales—The Holiday Stocking Nightmare
Every retailer dreams of selling out during the holiday season, but for one national chain, that dream was turning into a nightmare. Sales varied drastically between stores, with some shelves going bare and others overflowing with unsold stock.
Define the Problem: The company needed to figure out why some stores were underperforming while others exceeded expectations. Were local preferences or external factors like weather playing a role?
Develop Hypothesis: The team hypothesized that regional differences in weather and customer demographics could explain the sales variation.
Collect & Process Data: They collected two years' worth of sales records across 200 stores, along with weather data and foot traffic information. After processing the data, they standardized formats, removed duplicates, and addressed missing values.
Analyze: Using a regression analysis, the team found a clear link between regional weather patterns and product demand. Cold-weather regions sold more winter gear during storms, while stores in warmer areas saw consistent sales in gifts and holiday essentials.
Interpret Results: The analysis confirmed that inventory should be tailored to each region's unique needs. Northern stores should stock more winter gear, while southern stores should focus on gift items.
Communicate & Influence: Armed with these insights, the company reallocated inventory across stores, resulting in a 12% increase in overall sales during the holiday season.
Example 2: Subscription Churn Reduction for a Media Platform
A media streaming service was facing a problem common in the industry—subscribers were dropping off after just six months. Despite a steady stream of new users, 10% of them were leaving soon after their initial trial period ended.
Define the Problem: The team needed to understand why so many users were canceling their subscriptions after six months.
Develop Hypothesis: They hypothesized that early user engagement was a critical factor—those who didn’t engage with the platform right away were more likely to cancel later.
Collect & Process Data: They gathered data on user activity, such as how many hours of content each user watched in their first month. After processing, they filled in missing data points and cleaned up inconsistencies across user records.
Analyze: A clustering algorithm was used to group users based on their engagement levels. The analysis showed that users who watched fewer than five hours of content in the first month were 30% more likely to churn after six months.
Interpret Results: The results suggested that early engagement was key to retaining subscribers. The company now had a clear understanding of which users were at risk of leaving.
Communicate & Influence: The company launched a personalized marketing campaign, recommending new content to less engaged users based on their viewing history. This led to an 8% reduction in churn over the following three months.
Example 3: Manufacturing Efficiency—The Silent Saboteur
In the manufacturing world, downtime can be costly. One major manufacturer was dealing with frequent equipment malfunctions that disrupted production schedules and increased operational costs.
Define the Problem: The company needed to pinpoint why certain machines were breaking down more frequently, leading to inefficiencies on the production line.
Develop Hypothesis: They hypothesized that their fixed maintenance schedule wasn’t frequent enough for certain high-use machines.
Collect & Process Data: Data was collected from machine logs, including downtime records, maintenance schedules, and sensor data from equipment over the past 18 months. After cleaning the data, they removed outliers and noise from sensor readings.
Analyze: Using predictive analytics, the team discovered that specific machines had a much higher risk of failure due to their operational loads. The analysis showed that adjusting the maintenance schedule based on machine usage could significantly reduce breakdowns.
Interpret Results: The insights indicated that machines used more frequently required more maintenance, rather than following the same schedule as lower-use machines.
Communicate & Influence: The company implemented a predictive maintenance system, which helped reduce equipment downtime by 15%, boosting production efficiency and reducing waste.
Wrapping It All Up
By following a structured framework, these companies were able to turn data into insights that improved decision-making and drove real change. Whether it’s optimizing retail sales, reducing churn, or enhancing manufacturing efficiency, this framework ensures that no step is overlooked.
Remember, successful data analytics isn’t just about analyzing numbers—it's about following a process that leads from a well-defined problem to actionable solutions. Applying this approach will not only help you extract insights but also influence decisions that lead to meaningful results.
Learn More with FYT Consulting
At FYT Consulting, we offer a 2-day Problem Solving Using Data Analytics course that dives deep into these steps, teaching you how to master each phase of the framework. In this course, you'll learn the popular techniques applied at each step, from hypothesis development to communicating insights effectively. Whether you're a data professional or a business leader, our course will equip you with the tools and methods to harness the full power of data analytics.


Comments