
Two Groups, One Question: Is the Difference Significant?
- Michael Lee, MBA

- 1 day ago
- 3 min read

The T-Test: How an Irish Brewer Revolutionized Statistical Analysis
Continuing Our Inferential Analysis Series
This article continues our deep dive into inferential analysis and hypothesis testing. In the previous pieces, we explored:
Now we turn our attention to the T-Test, used to compare the means between two groups.
The Story Behind the Test
The T-Test has an unexpected origin—it was developed in the early 1900s by William Sealy Gosset, a statistician working for Guinness Brewery in Dublin. The brewery needed to ensure quality across small batches of beer and couldn’t afford to test entire populations. Gosset created a new method—Student’s T-Test—for making confident decisions using small samples. Published under a pseudonym (to protect trade secrets), his work became a foundation of modern statistics.
What Is the Objective?
The T-Test helps us determine whether the average (mean) of two groups is significantly different. This is helpful for:
Comparing customer behavior across two promotions
Evaluating drug performance between two groups
Determining salary differences across departments
Assessing training effectiveness across delivery modes
Unlike Chi-Square (which compares categories), the T-Test works with numerical data.
When Should You Use a T-Test?
✅ Use this test when:
You are comparing two independent groups
Your outcome is numerical (like spending, time, or scores)
The data is approximately normal
The groups have similar variance (standard deviation)
🚫 Don't use this test if your variables are categorical or if you have more than two groups—use Chi-Square or ANOVA instead.
How It Works
Step 1: Define Hypotheses
Null Hypothesis (H₀): The means of the two groups are equal.
Alternative Hypothesis (H₁): The means of the two groups are different.
Example 1: Energy Drink and Reaction Time
We test whether a new energy drink improves reaction time:
Group A (Control): No drink
Group B (Test): Consumes the energy drink
Their reaction times (in milliseconds) are recorded:
Group A (No Drink) | Group B (With Drink) |
250 | 230 |
270 | 210 |
260 | 215 |
255 | 220 |
275 | 225 |
280 | 235 |
265 | 210 |
250 | 200 |
270 | 220 |
260 | 215 |
Step 2: Calculate the T-Test Statistic
The formula is:

Where:
X̄₁, X̄₂ = Mean of each group
s₁², s₂² = Variance of each group
n₁, n₂ = Sample sizes (10 per group)
Step 2a: Compute the Means
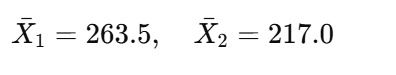
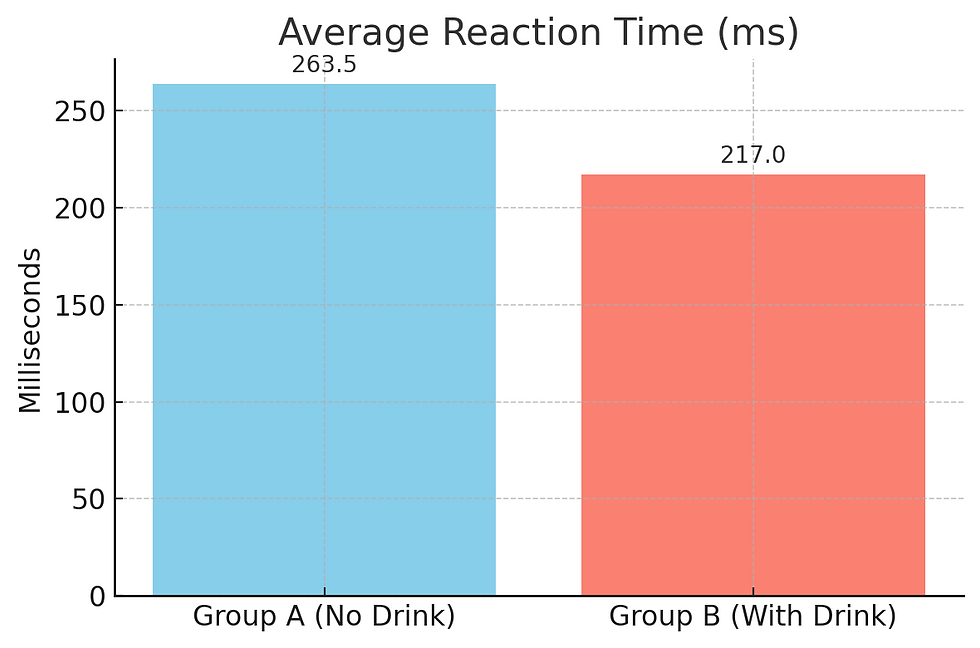
Step 2b: Compute the Variances

Step 2c: Compute the T-Statistic
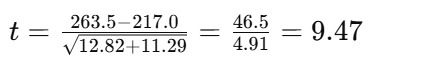
Step 3: Determine Statistical Significance
Degrees of freedom (df) = n₁ + n₂ – 2 = 18
Critical t-value at df = 18 and α = 0.05 (two-tailed) ≈ 2.101
Since t = 9.47 > 2.101, we reject the null hypothesis
p-value < 0.001: strong evidence that the means are different
✅ Result: The energy drink significantly improves reaction time. The improvement is unlikely due to chance.
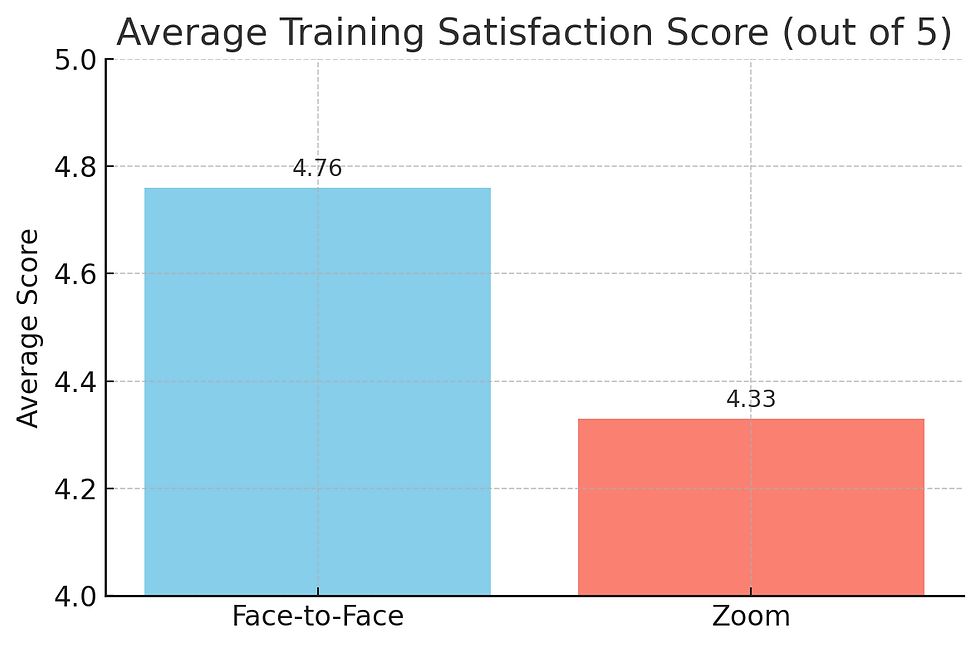
Example 2: Face-to-Face vs Zoom Training
You want to evaluate whether training delivery format affects participant satisfaction. After conducting the same training both face-to-face and over Zoom, you collect evaluation scores (out of 5) from each group.
Face-to-Face Scores | Zoom Scores |
|---|---|
4.8 | 4.5 |
4.6 | 4.4 |
4.7 | 4.3 |
4.9 | 4.5 |
4.8 | 4.2 |
4.6 | 4.4 |
4.7 | 4.3 |
4.8 | 4.1 |
4.9 | 4.4 |
4.7 | 4.2 |
Average scores seem higher for face-to-face sessions. But is that difference meaningful or could it be random variation?
You run a T-Test and find:
t = 3.62, df = 18, p = 0.002
Since p < 0.05, the difference is statistically significant
✅ Result: Face-to-face training yields significantly higher satisfaction scores than Zoom. Trainers may want to consider hybrid strategies or boost engagement methods online.
Real-World Applications
1. Business & Pricing Strategies
Test whether discounted customers spend more than non-discounted ones.
2. Healthcare & Drug Testing
Compare patient outcomes under different treatments.
3. Education & Learning Methods
Evaluate different teaching methods or delivery formats—like face-to-face vs Zoom.
Final Thoughts
The T-Test is a must-have in your statistical toolkit. It’s easy to compute, practical, and powerful for answering the age-old question: “Is this difference real?”
If you want to gain hands-on experience with hypothesis testing and other powerful analytical techniques, our 2-day course, Problem Solving Using Data Analytics, provides practical applications and real-world exercises. For those curious about how Generative AI can enhance statistical testing, our Data Analytics in the Age of AI course explores AI-driven analytics and automation.
Ready to make statistically sound decisions? Join us and elevate your analytical skills today!


Comments